
Home > Research > Research Results > Research Results 2018 > A method for estimating species richness and densities by distinguishing imperfect detection and temporary movement
Update:January 25, 2018
Main content starts here.
A method for estimating species richness and densities bydistinguishing imperfect detection and temporary movement
| Article title |
Community distance sampling models allowing for imperfect detection and temporary emigration |
|---|---|
| Author (affiliation) |
Yuichi Yamaura (a)、J. Andrew Royle (b) (a) Department of Forest Vegetation, FFPRI, Tsukuba, Ibaraki, Japan. |
| Publication Journal |
Ecosphere, 8(12), December 2017, DOI: 10.1002/ecs2.2028( External link ) |
| Content introduction |
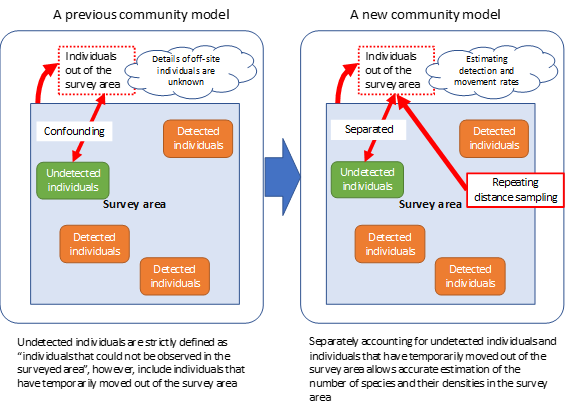
In field surveys, it is difficult to detect all animals; thus, in many cases, individuals remain undetected. Therefore, in this study, we developed a community model that distinguishes between imperfect detection and temporary movement out of the survey area. When this model was applied to survey data on birds, the probability of animal movement outside of the survey area was as small as 0.14 in skylarks and as large as 0.98 in blue-and-white flycatchers. Therefore, probabilities of temporary movements largely depend on the species. If temporary movements are ignored, bird densities and species richness can be overestimated.
Note: The distance sampling is a method to record the distance from the investigator to the detected individual.
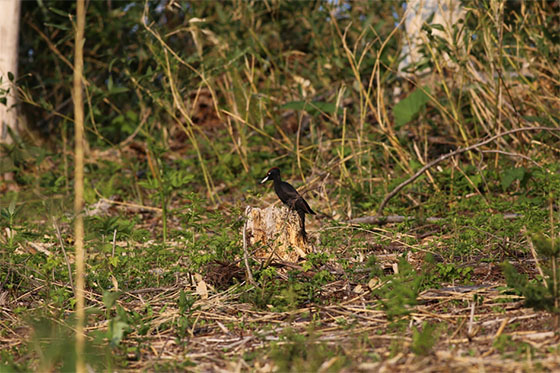
Photo. Black woodpecker feeding on a stump at a logging site in a forest plantation. Woodpeckers, including the black woodpecker and great spotted woodpecker, are known for their wide home ranges. In conventional models that do not distinguish between the detection rate and temporary movement rate, the density of these bird species is overestimated, resulting in an overestimation of species numbers and densities. It is expected that one can appropriately estimate species numbers and densities by distinguishing detection and temporary movement rates via repeated distance sampling in a survey area. |
Copyright © Forest Research and Management Organization. All rights reserved.